
U.S. Senate
Moody +3
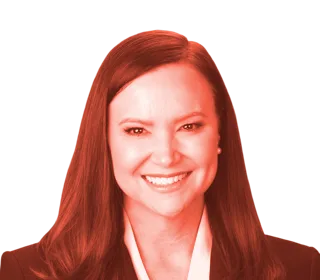
(R)
48%
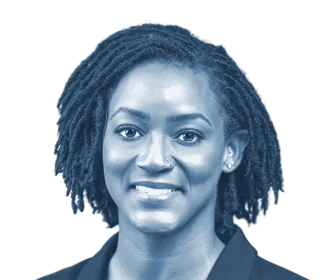
(D)
45%
Narrow lead, within the margin of error.
October 30–31, 2026
Moody holds a narrow lead over Nixon for Senate
Moody +3
Narrow lead, within the margin of error.
Donalds +2
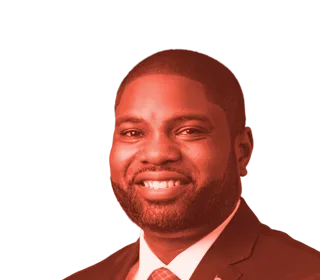
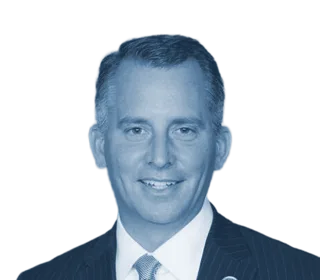
Narrow lead, within the margin of error.
Early voters were asked how they voted. Shares may not total 100 because of rounding. A dash means the release doesn't report that answer.
Leads are computed before rounding, so they can differ by 1 point from the shares shown.
Ashley Moody has a narrow lead over Angie Nixon for Senate in Florida, 48% to 45%, in our poll of 2,898 likely voters, taken October 30 to 31. That is within the poll's ±2.1-point margin of error. Undecided and other answers: 7%.
Byron Donalds has a narrow lead over David Jolly for governor, 48% to 46%, within the margin of error.
Independents favor Nixon, 54% to 30%. Independents here are people who did not call themselves Democrats or Republicans, whatever their registration. Women favor Moody, 48% to 46%. Men favor Moody, 50% to 43%.
If Democrats win control, by registered party from the Florida voter file.
“If Democrats win control of the House of Representatives in the 2026 election, which of these people would you prefer to see as Speaker of the House?” Options shown in random order.
| Answer | Republicansn = 1,245 · ±3.2 | Democratsn = 994 · ±3.6 | No party (NPA)n = 527 · ±5.1 | Minor partiesn = 132 · ±10.6 |
|---|---|---|---|---|
| AOC | 3% | 41% | 25% | — |
| Jeffries | 5% | 30% | 14% | — |
| Someone else | 69% | 18% | 39% | 44% |
| No opinion | 23% | 12% | 23% | — |
“If Democrats win control of the Senate in the 2026 election, which of these people would you prefer to see as Senate Majority Leader?” Options shown in random order.
| Answer | Republicansn = 1,245 · ±3.2 | Democratsn = 994 · ±3.6 | No party (NPA)n = 527 · ±5.1 | Minor partiesn = 132 · ±10.6 |
|---|---|---|---|---|
| Sanders | 5% | 43% | 26% | — |
| Schumer | 4% | 9% | 6% | — |
| Someone else | 65% | 36% | 46% | 54% |
| No opinion | 25% | 12% | 22% | — |
Weighted percentages of likely voters by registered party. Each column sums to 100 apart from rounding. — fewer than 30 respondents gave this answer. ± is the 95% margin of error for that group.
We published our Oct 20–23 poll at Moody 50, Nixon 43 and Donalds 49, Jolly 44, and those numbers stand. This poll uses an updated model. Run through it, the Oct 20–23 interviews give Moody +4 and Donalds +2, close to this poll's Moody +3 and Donalds +2, so most of the difference between our two polls is the model, not voters changing their minds.
We re-interviewed 534 of the first poll's voters a week later. Run through the same turnout model, the two polls agree.
Senate: Moody 48%, Nixon 44% (Moody +4)
Governor: Donalds 48%, Jolly 45% (Donalds +2)
Senate: Moody 48%, Nixon 45% (Moody +3)
Governor: Donalds 48%, Jolly 46% (Donalds +2)
98% of decided Senate voters and 97% of decided governor voters kept their pick.
The handful who switched went 3 to 1 toward Nixon and 6 to 1 toward Jolly. Earlier undecideds who chose broke 15–10 for Nixon.
Leads are from the unrounded shares, so a lead can differ by 1 point from the printed shares' difference. The re-interview counts are unweighted and small; they show stability, not a trend.
Two weeks before Election Day, our Oct 20–23 Florida poll showed Republicans ahead. At the same time, Florida's own early-vote reports showed Democrats and voters with no party affiliation turning out at rates far above 2022. Polls model the likely electorate on past turnout. If this year's voters really are different, that model is wrong.
So we went back into the field to answer one question: is the electorate changing, and if it is, what does that do to the race? We were weighing a model change before the new surveys came in, and fielded them to see whether the evidence called for one.
When we changed what. Both new weighting targets were set after fieldwork and after we had seen earlier results: the party target on Oct 31 and the 2024-vote target on Nov 1. We had written down a rule in advance for changing the turnout target, and we dropped it in favour of the projection below. Our first version of that projection also counted about one day of ballots twice; we caught it and corrected it before publishing. Judge the change knowing all of that.
Our headline numbers come from the Oct 30–31 poll alone. An experimental estimate that combines the two statewide polls is on the data page, labelled as experimental.
These are official counts from the Florida Division of Elections and the state voter file, not survey answers.
Our earlier model expected the electorate to be 21 points more Republican than Democratic by registered party. We replaced that with a projection built from this year's early-vote counts, completed with 2022's late vote, done two ways and averaged.
The result: 46% Republican, 33% Democratic, 19% NPA, 3% minor parties: R+13.
Against registration, each party's share of voters minus its share of registered voters:
| Republicans | Democrats | NPA | |
|---|---|---|---|
| 2022 (last midterm) | +9 | −1 | −8 |
| 2024 | +3 | 0 | −3 |
| 2026, our projection | +4 | +3 | −5 |
Against the last midterm, Republicans out-vote their registration by far less, and Democrats out-vote theirs for the first time in these three elections.
Most pollsters now adjust their samples so respondents' remembered 2024 vote matches the official result. Our respondents remember voting Harris about 6 points more than Florida actually did. Left alone, that would tilt the poll toward Democrats; the adjustment pulls it back.
That adjustment matters a lot here: turning it off moves the Senate race about 8 points. So we tested it every way the records allow.
So we set the 2024 target to the records-based estimate for this year's projected voters (42.7% Harris), then adjusted it for that measured misremembering, giving 44.0%. Both inputs come from outside our poll. Records can't see how individuals voted, only places and parties.
AI models from several companies reviewed the data and methods: Claude Opus and Claude Fable (Anthropic), Codex (OpenAI) and Muse (Meta). Each could read every output and the code but change nothing. Their reviews are advice, not proof.
In the complete-evidence round:
| 2024-vote target | Senate | Governor |
|---|---|---|
| Records-based, adjusted for misremembering (44.0%): our estimate | Moody 48, Nixon 45 (Moody +3) | Donalds 47, Jolly 46 (Donalds +2) |
| Records-based, no adjustment (42.7%) | Moody 49, Nixon 44 (Moody +5) | Donalds 48, Jolly 45 (Donalds +3) |
| Certified 2024 result (43.4%) | Moody 48, Nixon 44 (Moody +4) | Donalds 48, Jolly 45 (Donalds +3) |
| Certified result, adjusted for misremembering | Moody 48, Nixon 45 (Moody +2) | Donalds 47, Jolly 46 (Donalds +1) |
| No 2024-vote target | Nixon +4 | Jolly +6 |
| No party or 2024-vote targets | Nixon +12 | Jolly +13 |
Leads are computed before rounding, so they can differ by 1 point from the shares shown. Without a 2024-vote target the poll reflects our respondents' remembered vote, which runs well to the left of Florida's result. The records suggest much of that is who answers polls and how people remember, but they can't fully separate the two.
Margin of sampling error: ±2.1 points per candidate, ±4.1 on the gap. That covers sampling only, not uncertainty about who turns out or about our model. Both races are within the margin.
The 56% and 52% lines are our judgment, not a calculation. Our Oct 30 mix covers the 4,726,493 early and mail ballots reported through Friday, Oct 30; the real first count also includes weekend and Monday early votes and late mail, which that mix doesn't. The real test of the turnout projection is Election Day turnout by party.
Each case re-runs the full weighting with a different electorate. As counties count the ballots cast after the Oct 30 report (weekend early votes, late mail and Election Day), the returns will show which one Florida is closest to.
Senate: Moody +1
Governor: Jolly +1
Ballots after the Oct 30 report: R+19
Final electorate by party: R+9
Senate: Moody +3
Governor: Donalds +2
Ballots after the Oct 30 report: R+28
Final electorate by party: R+13
Senate: Moody +6
Governor: Donalds +5
Ballots after the Oct 30 report: R+37
Final electorate by party: R+16
44% of the two-candidate vote in the ballots after the Oct 30 report
We expect 39%
43% of the two-candidate vote in the ballots after the Oct 30 report
We expect 40%
We expect R+28
R+19 or less: the surge is carrying. R+37 or more: the Republican leads grow.
Ballots cast after the Oct 30 report means every ballot not in the state's count of ballots cast through Friday, Oct 30, posted Oct 31: weekend early votes, late mail and Election Day. The R−D figures (R+19, R+28, R+37 statewide, and the county R−D columns) are registered-party makeup: Republican minus Democratic ballots, in points of all ballots. They are not candidate margins, and the 2026 figures are not Election Day check-ins alone. County needs are illustrative under a uniform statewide shift. Nixon needs is illustrative: the share that would produce a statewide tie if every county moved by the same amount (+3 points).
| County | Democratic minus Republican ballots | Ballots cast |
|---|---|---|
| Alachua | D+31 | 65,147 |
| Baker | R+60 | 5,430 |
| Bay | R+40 | 45,432 |
| Bradford | R+37 | 4,416 |
| Brevard | R+14 | 177,762 |
| Broward | D+32 | 415,681 |
| Calhoun | R+50 | 2,255 |
| Charlotte | R+31 | 70,239 |
| Citrus | R+37 | 46,771 |
| Clay | R+32 | 57,195 |
| Collier | R+33 | 117,098 |
| Columbia | R+34 | 14,369 |
| DeSoto | R+22 | 5,153 |
| Dixie | R+58 | 3,027 |
| Duval | D+11 | 214,413 |
| Escambia | R+13 | 64,682 |
| Flagler | R+23 | 46,004 |
| Franklin | R+20 | 2,741 |
| Gadsden | D+50 | 9,435 |
| Gilchrist | R+54 | 3,457 |
| Glades | R+34 | 1,568 |
| Gulf | R+49 | 4,154 |
| Hamilton | R+20 | 1,974 |
| Hardee | R+40 | 3,130 |
| Hendry | R+16 | 6,043 |
| Hernando | R+20 | 46,734 |
| Highlands | R+31 | 24,143 |
| Hillsborough | D+6 | 327,649 |
| Holmes | R+66 | 2,578 |
| Indian River | R+26 | 53,828 |
| Jackson | R+28 | 8,863 |
| Jefferson | R+10 | 3,718 |
| Lafayette | R+70 | 1,085 |
| Lake | R+13 | 103,874 |
| Lee | R+25 | 227,185 |
| Leon | D+30 | 72,415 |
| Levy | R+36 | 8,293 |
| Liberty | R+50 | 1,460 |
| Madison | R+12 | 4,250 |
| Manatee | R+20 | 114,241 |
| Marion | R+18 | 91,569 |
| Martin | R+28 | 50,993 |
| Miami-Dade | D+3 | 485,722 |
| Monroe | R+12 | 20,439 |
| Nassau | R+39 | 33,873 |
| Okaloosa | R+40 | 44,382 |
| Okeechobee | R+35 | 5,821 |
| Orange | D+22 | 295,786 |
| Osceola | D+15 | 82,668 |
| Palm Beach | D+15 | 347,985 |
| Pasco | R+11 | 139,641 |
| Pinellas | D+1 | 245,952 |
| Polk | R+2 | 139,831 |
| Putnam | R+30 | 14,176 |
| St. Johns | R+27 | 97,287 |
| St. Lucie | D+3 | 96,995 |
| Santa Rosa | R+45 | 40,552 |
| Sarasota | R+13 | 146,425 |
| Seminole | D+3 | 120,214 |
| Sumter | R+40 | 71,113 |
| Suwannee | R+44 | 8,658 |
| Taylor | R+41 | 3,674 |
| Union | R+50 | 1,791 |
| Volusia | R+11 | 154,491 |
| Wakulla | R+25 | 8,270 |
| Walton | R+55 | 19,203 |
| Washington | R+50 | 4,134 |
| County | Region | Nixon minus Moody |
|---|---|---|
| Alachua | North | Moody +13 |
| Baker | North | Moody +13 |
| Bay | North | Moody +13 |
| Bradford | North | Moody +13 |
| Brevard | Central | Nixon +1 |
| Broward | Southeast | Nixon +10 |
| Calhoun | North | Moody +13 |
| Charlotte | Southwest | Moody +28 |
| Citrus | Tampa Bay | Moody +2 |
| Clay | North | Moody +13 |
| Collier | Southwest | Moody +28 |
| Columbia | North | Moody +13 |
| DeSoto | Tampa Bay | Moody +2 |
| Dixie | North | Moody +13 |
| Duval | North | Moody +13 |
| Escambia | North | Moody +13 |
| Flagler | North | Moody +13 |
| Franklin | North | Moody +13 |
| Gadsden | North | Moody +13 |
| Gilchrist | North | Moody +13 |
| Glades | Central | Nixon +1 |
| Gulf | North | Moody +13 |
| Hamilton | North | Moody +13 |
| Hardee | Tampa Bay | Moody +2 |
| Hendry | Southeast | Nixon +10 |
| Hernando | Tampa Bay | Moody +2 |
| Highlands | Central | Nixon +1 |
| Hillsborough | Tampa Bay | Moody +2 |
| Holmes | North | Moody +13 |
| Indian River | Central | Nixon +1 |
| Jackson | North | Moody +13 |
| Jefferson | North | Moody +13 |
| Lafayette | North | Moody +13 |
| Lake | Central | Nixon +1 |
| Lee | Southwest | Moody +28 |
| Leon | North | Moody +13 |
| Levy | North | Moody +13 |
| Liberty | North | Moody +13 |
| Madison | North | Moody +13 |
| Manatee | Tampa Bay | Moody +2 |
| Marion | North | Moody +13 |
| Martin | Southeast | Nixon +10 |
| Miami-Dade | Miami-Dade | Nixon +5 |
| Monroe | Miami-Dade | Nixon +5 |
| Nassau | North | Moody +13 |
| Okaloosa | North | Moody +13 |
| Okeechobee | Central | Nixon +1 |
| Orange | Central | Nixon +1 |
| Osceola | Central | Nixon +1 |
| Palm Beach | Southeast | Nixon +10 |
| Pasco | Tampa Bay | Moody +2 |
| Pinellas | Tampa Bay | Moody +2 |
| Polk | Tampa Bay | Moody +2 |
| Putnam | North | Moody +13 |
| St. Johns | North | Moody +13 |
| St. Lucie | Southeast | Nixon +10 |
| Santa Rosa | North | Moody +13 |
| Sarasota | Southwest | Moody +28 |
| Seminole | Central | Nixon +1 |
| Sumter | Central | Nixon +1 |
| Suwannee | North | Moody +13 |
| Taylor | North | Moody +13 |
| Union | North | Moody +13 |
| Volusia | Central | Nixon +1 |
| Wakulla | North | Moody +13 |
| Walton | North | Moody +13 |
| Washington | North | Moody +13 |
| Region | Nixon | Moody | Margin | n |
|---|---|---|---|---|
| North | 41% | 53% | Moody +13 | 623 |
| Central | 47% | 46% | Nixon +1 | 566 |
| Tampa Bay | 46% | 48% | Moody +2 | 596 |
| Southwest | 33% | 61% | Moody +28 | 315 |
| Southeast | 52% | 42% | Nixon +10 | 318 |
| Miami-Dade | 45% | 41% | Nixon +5 | 247 |
| County | Expected Nixon % | Nixon needs % (illustrative) |
|---|---|---|
| Alachua | 68% | 71% |
| Baker | 29% | 32% |
| Bay | 38% | 41% |
| Bradford | 39% | 42% |
| Brevard | 48% | 51% |
| Broward | 70% | 73% |
| Calhoun | 33% | 36% |
| Charlotte | 41% | 44% |
| Citrus | 41% | 44% |
| Clay | 41% | 44% |
| Collier | 40% | 43% |
| Columbia | 40% | 43% |
| DeSoto | 47% | 50% |
| Dixie | 30% | 33% |
| Duval | 60% | 63% |
| Escambia | 49% | 52% |
| Flagler | 46% | 48% |
| Franklin | 47% | 50% |
| Gadsden | 75% | 78% |
| Gilchrist | 32% | 35% |
| Glades | 38% | 41% |
| Gulf | 34% | 37% |
| Hamilton | 46% | 49% |
| Hardee | 39% | 42% |
| Hendry | 48% | 51% |
| Hernando | 49% | 52% |
| Highlands | 41% | 43% |
| Hillsborough | 60% | 63% |
| Holmes | 27% | 30% |
| Indian River | 43% | 46% |
| Jackson | 43% | 46% |
| Jefferson | 50% | 53% |
| Lafayette | 25% | 28% |
| Lake | 49% | 52% |
| Lee | 44% | 47% |
| Leon | 68% | 71% |
| Levy | 39% | 42% |
| Liberty | 33% | 36% |
| Madison | 50% | 53% |
| Manatee | 49% | 52% |
| Marion | 48% | 50% |
| Martin | 43% | 46% |
| Miami-Dade | 58% | 61% |
| Monroe | 50% | 53% |
| Nassau | 39% | 42% |
| Okaloosa | 38% | 41% |
| Okeechobee | 37% | 40% |
| Orange | 65% | 68% |
| Osceola | 62% | 65% |
| Palm Beach | 62% | 65% |
| Pasco | 53% | 56% |
| Pinellas | 58% | 61% |
| Polk | 57% | 60% |
| Putnam | 42% | 45% |
| St. Johns | 44% | 47% |
| St. Lucie | 57% | 60% |
| Santa Rosa | 36% | 39% |
| Sarasota | 49% | 52% |
| Seminole | 56% | 59% |
| Sumter | 36% | 39% |
| Suwannee | 36% | 39% |
| Taylor | 37% | 40% |
| Union | 33% | 36% |
| Volusia | 50% | 53% |
| Wakulla | 44% | 47% |
| Walton | 32% | 34% |
| Washington | 34% | 36% |
| County | Banked ballots | Expected Nixon | Nixon needs (illustrative) | Expected Jolly | 2022 Election Day (R−D) | Ballots after the Oct 30 report (R−D) |
|---|---|---|---|---|---|---|
| Miami-Dade | 447,511 | 58% | 61% | 58% | R+6 | R+13 |
| Broward | 376,023 | 70% | 73% | 71% | D+6 | D+7 |
| Palm Beach | 322,578 | 62% | 65% | 63% | R+16 | R+14 |
| Hillsborough | 299,923 | 60% | 63% | 61% | R+18 | R+18 |
| Orange | 271,139 | 65% | 68% | 65% | R+1 | R+6 |
| Pinellas | 230,006 | 58% | 61% | 59% | R+26 | R+20 |
| Lee | 210,874 | 44% | 47% | 45% | R+41 | R+52 |
| Duval | 195,613 | 60% | 63% | 60% | R+16 | R+20 |
| Brevard | 161,008 | 48% | 51% | 49% | R+37 | R+37 |
| Volusia | 140,643 | 50% | 53% | 51% | R+34 | R+34 |
| Sarasota | 137,777 | 49% | 52% | 51% | R+46 | R+44 |
| Polk | 126,900 | 57% | 60% | 57% | R+36 | R+37 |
| Pasco | 125,796 | 53% | 56% | 54% | R+36 | R+37 |
| Seminole | 110,215 | 56% | 59% | 56% | R+21 | R+23 |
| Collier | 107,874 | 40% | 43% | 42% | R+49 | R+53 |
| Osceola | 75,578 | 62% | 65% | 63% | R+9 | R+12 |
Nixon and Jolly percentages are shares of the two-candidate vote in the first early-and-mail count. The windows differ: 2022 is Election Day proper; 2026 is every ballot expected after the Oct 30 report, under our estimate. County expectations combine our regional poll results with each county's early ballots by party; they are not county polls. The early-vote map uses the Nov 1 report (ballots through Oct 31); the first-drop map and this table use the Oct 31 report (ballots through Oct 30). Broward, Miami-Dade, Palm Beach and Hillsborough are where the cases differ most in votes, so watch them first.
| Where | Democrats' surge keeps going on Election Day | Our estimate | Election Day runs heavier Republican |
|---|---|---|---|
| Statewide | R+19 | R+28 | R+37 |
| Broward | D+16 | D+7 | R+4 |
| Miami-Dade | R+4 | R+13 | R+23 |
| Palm Beach | R+5 | R+14 | R+24 |
| Hillsborough | R+9 | R+18 | R+28 |
The R−D figures (R+19, R+28, R+37 statewide, and the county R−D columns) are registered-party makeup: Republican minus Democratic ballots, in points of all ballots. They are not candidate margins, and the 2026 figures are not Election Day check-ins alone.
Data for analysts. Downloads, response rates, full methods, questionnaires and voter-file tables: Florida poll data.
How each group answered every question: gender, age, race, education, party, ideology, 2024 vote, turnout and geography.
Groups of fewer than 50 interviews are not shown; 50 to 99 are marked for caution.
Photos. Cropped, cut out from their backgrounds and tinted for this page.


