NV-03 · U.S. House
Lee +7.7
SL
Susie Lee(D)
49.4%
MO
Marty O'Donnell(R)
41.7%
Leads, within the margin of error.
October 20–23, 2026 · NV-03
Lee leads O'Donnell for the House
Lee +7.7
Leads, within the margin of error.
Ford +4.7

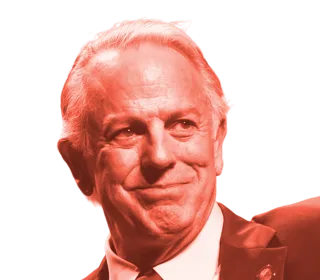
Narrow lead, within the margin of error.
How to read the races. Percent of likely voters. Lead is the leader's share minus the runner-up's: under 1 point is tied, 1 to 5 points a narrow lead, over 5 points leads. The margin on the gap between two candidates is larger than the ±5.1 on one share.
Photos. Joseph Lombardo: Gage Skidmore, CC BY-SA 3.0; via Wikimedia Commons, cropped and tinted. Other photos are official government portraits.
Susie Lee leads Marty O'Donnell for Congress in Nevada's 3rd Congressional District, 49.4% to 41.7%, in our poll of 687 likely voters, taken October 20 to 23. That's within the margin of error. The poll's margin of error is ±5.1 points. Undecided and other answers add up to 8.9%.
In the district, Aaron D. Ford has a narrow lead over Joseph Lombardo for governor, 47.1% to 42.4%, within the margin of error (n = 687; the poll's margin of error ±5.1 points).
Independents favor Lee, 48.6% to 30.4%. Women favor Lee, 53.2% to 35.8%. Men split, 47.8% O'Donnell to 47.3% Lee.
Hakeem Jeffries is underwater: 34.6% approve of how he's handling his job as House Democratic Leader, and 58.0% disapprove. Asked whether Jeffries should become Speaker if Democrats win the House, 47.9% said Democrats should choose someone else and 21.9% said Jeffries. Among Democrats, 46.3% want someone else.
Chuck Schumer is underwater: 30.2% approve of how he's handling his job as Senate Democratic Leader, and 63.2% disapprove. Asked whether Schumer should become Majority Leader if Democrats win the Senate, 61.8% said Democrats should choose someone else and 13.0% said Schumer. Among Democrats, 62.3% want someone else.
The crosstabs and our full methodology are on this page.
Voters who said they had already voted were asked who they voted for. Shares may not add to 100 because of rounding. A dash is an answer the release doesn't report on its own.
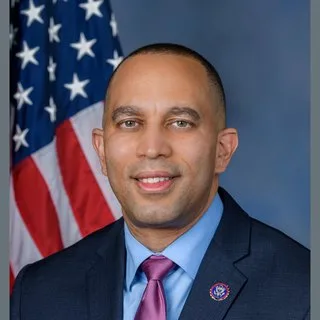
“Do you approve or disapprove of the way Hakeem Jeffries is handling his job as House Democratic Leader?”
ApproveDisapprove
“If Democrats win control of the House of Representatives in the 2026 election, should Hakeem Jeffries become Speaker of the House, or should Democrats choose someone else?”
Jeffries should become SpeakerDemocrats should choose someone else
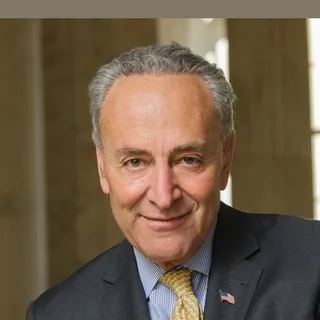
“Do you approve or disapprove of the way Chuck Schumer is handling his job as Senate Democratic Leader?”
ApproveDisapprove
“If Democrats win control of the Senate in the 2026 election, should Chuck Schumer become Majority Leader, or should Democrats choose someone else?”
Schumer should become Majority LeaderDemocrats should choose someone else

“Do you approve or disapprove of the way Donald Trump is handling his job as president?”
ApproveDisapprove
“Do you approve or disapprove of the way the Democrats in Congress are handling their job?”
ApproveDisapprove
“Do you approve or disapprove of the way the Republicans in Congress are handling their job?”
ApproveDisapprove
All likely voters: n = 687, ±5.1 points. Party is the party respondents said they identify with, or their voter-file registration where they didn't say; a smaller group carries a larger margin. Every poll
Pick any question in this poll and see how each group answered it: gender, age, race, education, party, ideology, 2024 vote, turnout and geography.
When a group has fewer than 50 interviews, its numbers are not shown; 50 to 99 interviews are marked for caution.
Disclosure. Sponsored by A Fight Worth Having (super PAC, FEC C00933085); conducted by RedBox Research, AFWH's polling unit. Text message invitation to a self-administered web survey. Nevada's 3rd Congressional District likely voters, n = 687, margin of error ±5.1 points including the design effect.