REDBOX RESEARCH · FLORIDA · OCTOBER 30, 2026
What if Florida’s early-voting gains last?
Democratic and registered-unaffiliated early-ballot counts are growing faster than Republican counts compared with the same point in 2022. We wanted to know what our existing survey would show if that difference carries through to the final electorate.
It is a question about who turns out. If more of some groups vote than our original model expected, the same survey answers can produce a different statewide result.
This is a conditional projection using the same completed interviews. It assumes the differences seen in early voting persist into final turnout, rather than simply reflecting people voting earlier. It does not replace our published poll.
See the results · Why test a different electorate? · What history tells us · How we calculated it · View the supporting cards
What the same survey would show
The cards below show conditional results alongside the original polling margins. Open either image for the full-size version.
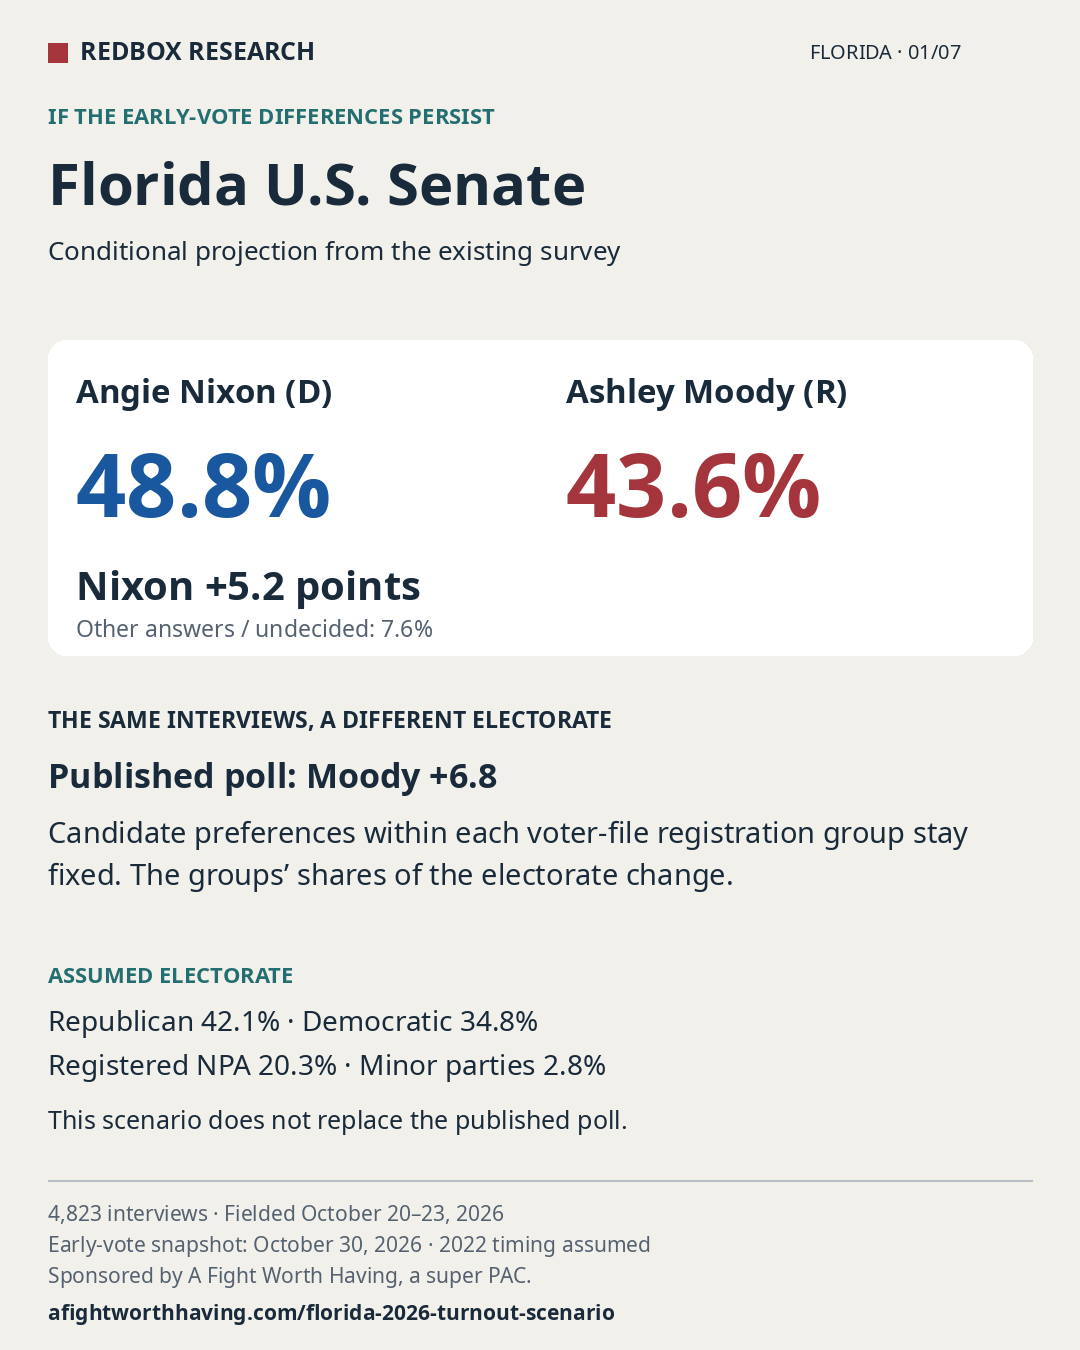
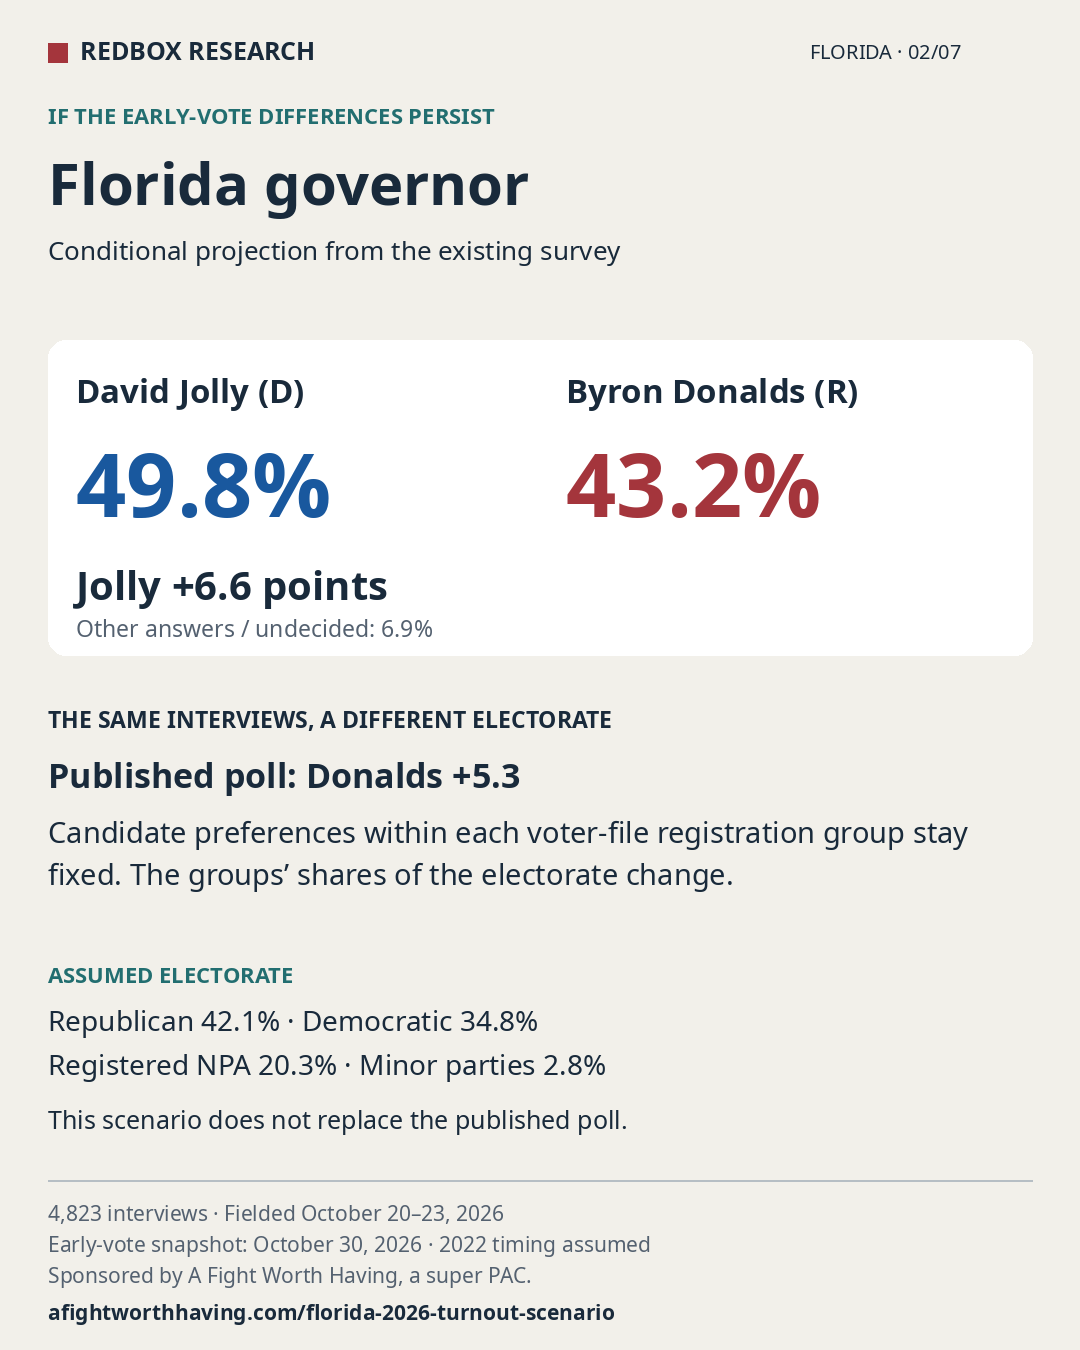
Our original Florida poll interviewed 4,823 likely voters from October 20–23. For this exercise, we kept those interviews and each registration group’s weighted candidate preferences, then changed the share of the electorate assigned to each group.
| Race | Published poll | If the turnout differences persist |
|---|---|---|
| U.S. Senate | Moody 49.6% Nixon 42.8% Moody +6.8 | Nixon 48.8% Moody 43.6% Nixon +5.2 |
| Governor | Donalds 49.2% Jolly 43.9% Donalds +5.3 | Jolly 49.8% Donalds 43.2% Jolly +6.6 |
Other candidates, undecided respondents and other answers remain in the totals. We have not assigned undecided voters to a candidate. These differences are the effect of a different electorate assumption, not a measured change in people’s minds.
Read the original poll and its survey methodology and questionnaire.
Why test a different electorate?
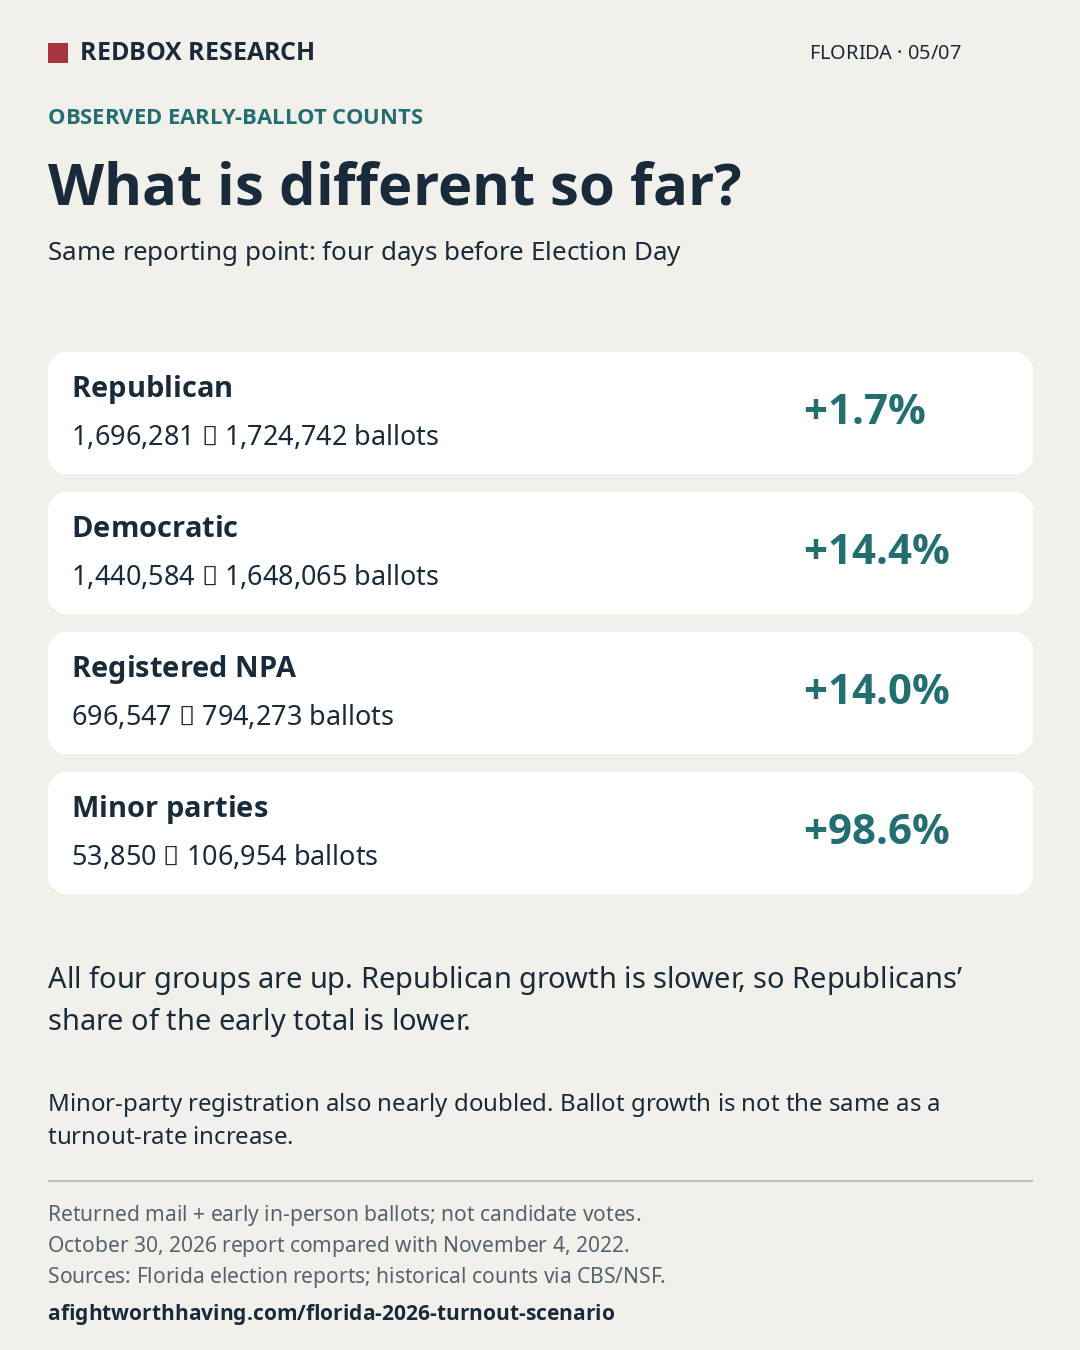
We compared Florida’s October 30, 2026 early-voting report with its November 4, 2022 report. Both reporting dates are four days before Election Day. The comparison combines returned mail ballots and early in-person voting; it excludes mail ballots that have not been returned.
| Voter-file registration | 2022 ballots | 2026 ballots | Change |
|---|---|---|---|
| Republican | 1,696,281 | 1,724,742 | +1.7% |
| Democratic | 1,440,584 | 1,648,065 | +14.4% |
| Unaffiliated (NPA) | 696,547 | 794,273 | +14.0% |
| Minor parties | 53,850 | 106,954 | +98.6% |
All four groups have cast more early ballots. But they are not growing at the same rate. Republicans’ share of the early total falls from 43.6% to 40.4%, while Democrats’ rises from 37.1% to 38.6%, NPA rises from 17.9% to 18.6%, and minor parties rise from 1.4% to 2.5%.
The registration figures make the Democratic and NPA increases worth examining. Their September registered populations are smaller than in 2022, yet their early-ballot counts are higher. Using each year’s September registration snapshot, Democratic early ballots rise from 29.0 to 39.9 per 100 registered voters; NPA rises from 17.5 to 23.7. Republican early ballots move from 32.3 to 30.4 per 100 registered voters.
Minor parties are a different story: their registration nearly doubled, much like their ballot count. That increase alone does not show a comparable jump in an individual’s likelihood of voting. These registration comparisons describe changing groups, not a study following the same people.
Throughout this analysis, “unaffiliated” means no-party-affiliation registration in the voter file. It does not mean people who call themselves independent in a survey. Minor-party registrants are counted separately. Registration tells us which group a voter belongs to; it does not reveal their ballot choice.
Early voting and Election Day do not have a fixed relationship
In 2022, Republicans relied more heavily on Election Day than Democrats. That remained true in 2024, but the difference narrowed as more Republicans voted early in person.
| Registration | 2022 | 2024 |
|---|---|---|
| Republican | 40.7% | 23.9% |
| Democratic | 29.6% | 21.4% |
| NPA | 39.8% | 28.8% |
| Minor parties | 41.4% | 30.4% |
Republicans’ early in-person share rose from 32.2% to 55.0%. Among all Election Day voters in these counties, Republican registrants accounted for 52.1% in 2022 and 43.8% in 2024. A late Republican advantage is something to account for, but its size is not a historical constant.
Some calendar patterns repeated. Both years show a Sunday slowdown nine days before Election Day and a rebound in the final week. But those daily records are not a complete party-by-day series, and dates can reflect processing or reporting. We cannot claim that all groups followed the same daily path.
These comparisons cover the same 60 counties, representing about three quarters of statewide turnout in each election. They are not statewide percentages. We excluded counties with substantial gaps in their feeds or hurricane-related voting arrangements that complicate the comparison. The 2024 presidential election supplies context about changing voting schedules; it is not treated as interchangeable with a midterm.
This history cuts both ways: the electorate could be changing, but the early-vote difference could also be people moving their votes earlier. We are testing the first possibility. We are not claiming that the current pattern is unprecedented in recent Florida history.
What changes in this calculation—and what stays
Our original likely-voter model helps estimate who will vote. This exercise replaces the original statewide registration-group shares with shares projected from the early-ballot comparison. It does not make those shares return to the original model’s targets.
It would be inaccurate to say this calculation has no basis in history or no connection to our original turnout scoring. History supplies the relationship between early and final turnout. Original survey weights, including their likely-voter adjustments, still shape the preferences measured within each registration group.
- Measure the early-ballot difference. Divide each group’s current early ballots by its early ballots at the matched point in 2022.
- Assume that difference lasts. Multiply the group’s reconstructed final 2022 turnout by that factor. This includes the remaining early vote and Election Day; those votes have not been left out.
- Calculate the new electorate shares. Divide each group’s projected turnout by the projected statewide total.
- Apply those shares to our survey. Keep the weighted candidate preferences within each registration group and change how much each group counts toward the statewide result.
| Registration | Original poll | Conditional scenario |
|---|---|---|
| Republican | 50.0% | 42.1% |
| Democratic | 28.9% | 34.8% |
| NPA | 18.4% | 20.3% |
| Minor parties | 2.6% | 2.8% |
This produces approximately 8.565 million voters. All four projected counts are below their registered populations. That makes the turnout possible; it does not tell us how likely it is.
Why the result moves so far
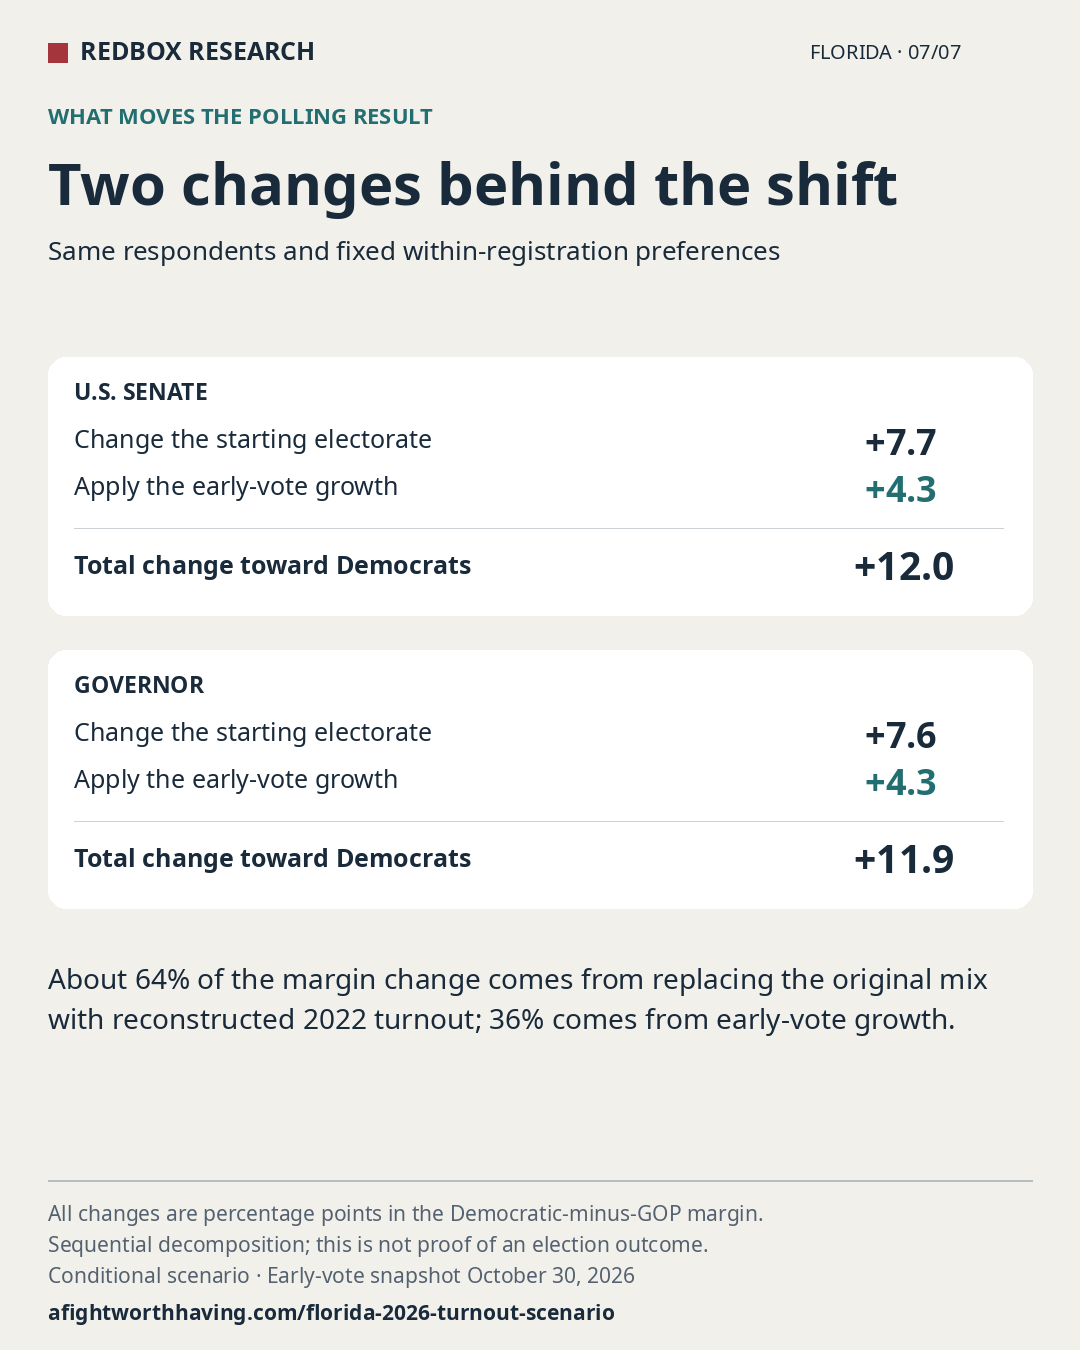
There are two changes behind the difference from the published poll: using the reconstructed 2022 electorate as the starting point, then applying this year’s uneven early-ballot growth. With just the 2022 mix and the same group preferences, Nixon would lead by 0.9 points and Jolly by 2.3. Applying the early-vote growth adds about 4.3 points to each Democratic margin. The entire difference from our original poll should not be attributed to early voting alone.
The choice to preserve preferences within each registration group matters too. As the groups’ shares change, the overall mix of ages, race, education, geography and recalled 2024 votes is allowed to change. A separate calculation that forces the original non-party targets and recalled-vote benchmarks back into place gives Moody +3.2 and Donalds +1.9 instead. That calculation changes preferences within the registration groups. It answers a different question and shows why the assumptions must accompany the headline numbers.
What would have to be true
The early-vote differences would have to survive into final participation, rather than be canceled out by fewer votes later. Each group’s remaining turnout would have to follow the assumed 2022 completion pattern. And the people who turn out within each group would need to resemble that group’s weighted survey respondents in their candidate preferences.
The current comparison uses cumulative snapshots at a matched point in the election calendar. It does not establish a steady daily growth rate throughout early voting. More observations could strengthen or weaken the case. Nor does it independently establish a younger electorate or identify newly mobilized voters.
Our conclusion is limited but useful: the early numbers give us a reason to examine a different electorate. If that electorate materializes, our existing survey shows how much the outcome could change.
The electorate and assumptions in five cards
Registered NPA preferences are measured survey responses. The electorate shares and the polling shift are conditional calculations. Early-ballot counts and historical comparisons provide context. Open any card for its full-size version.
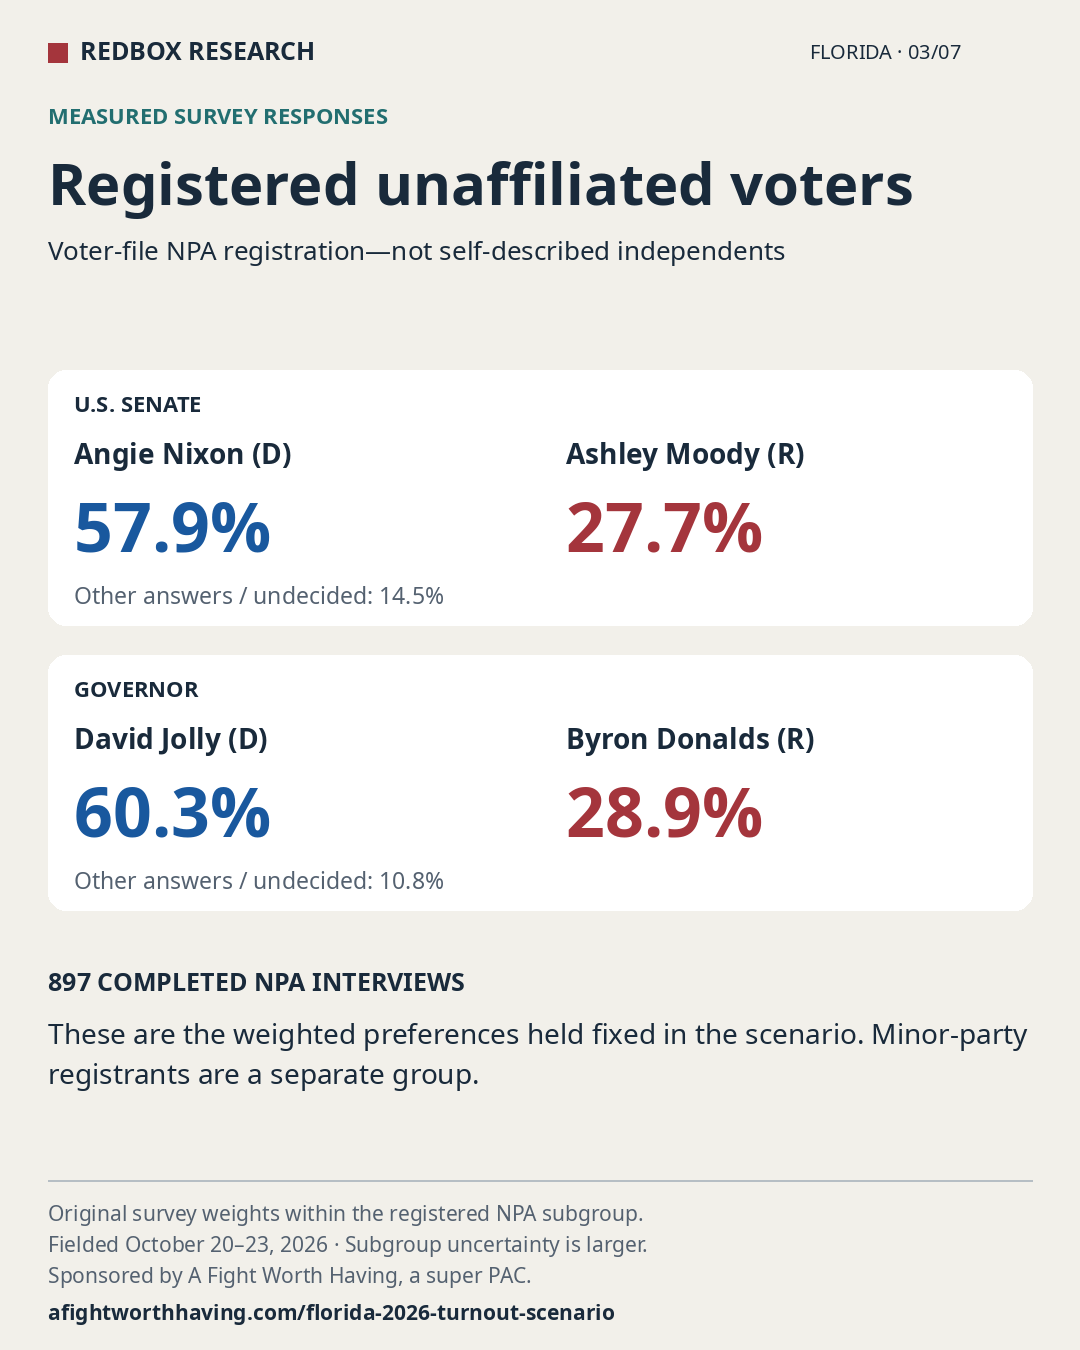
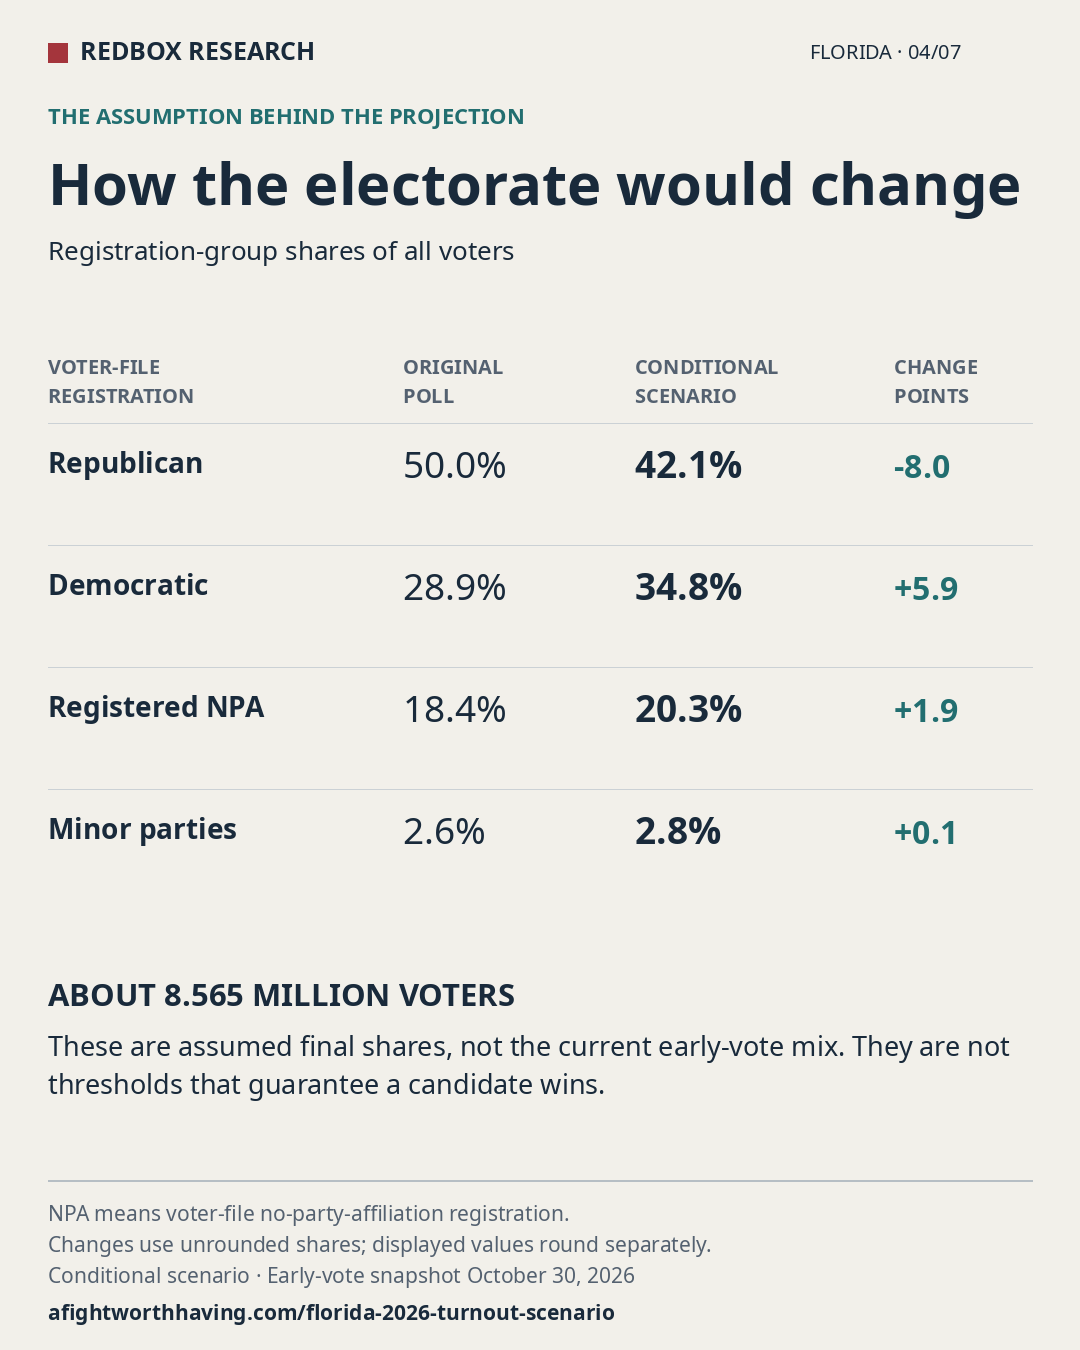
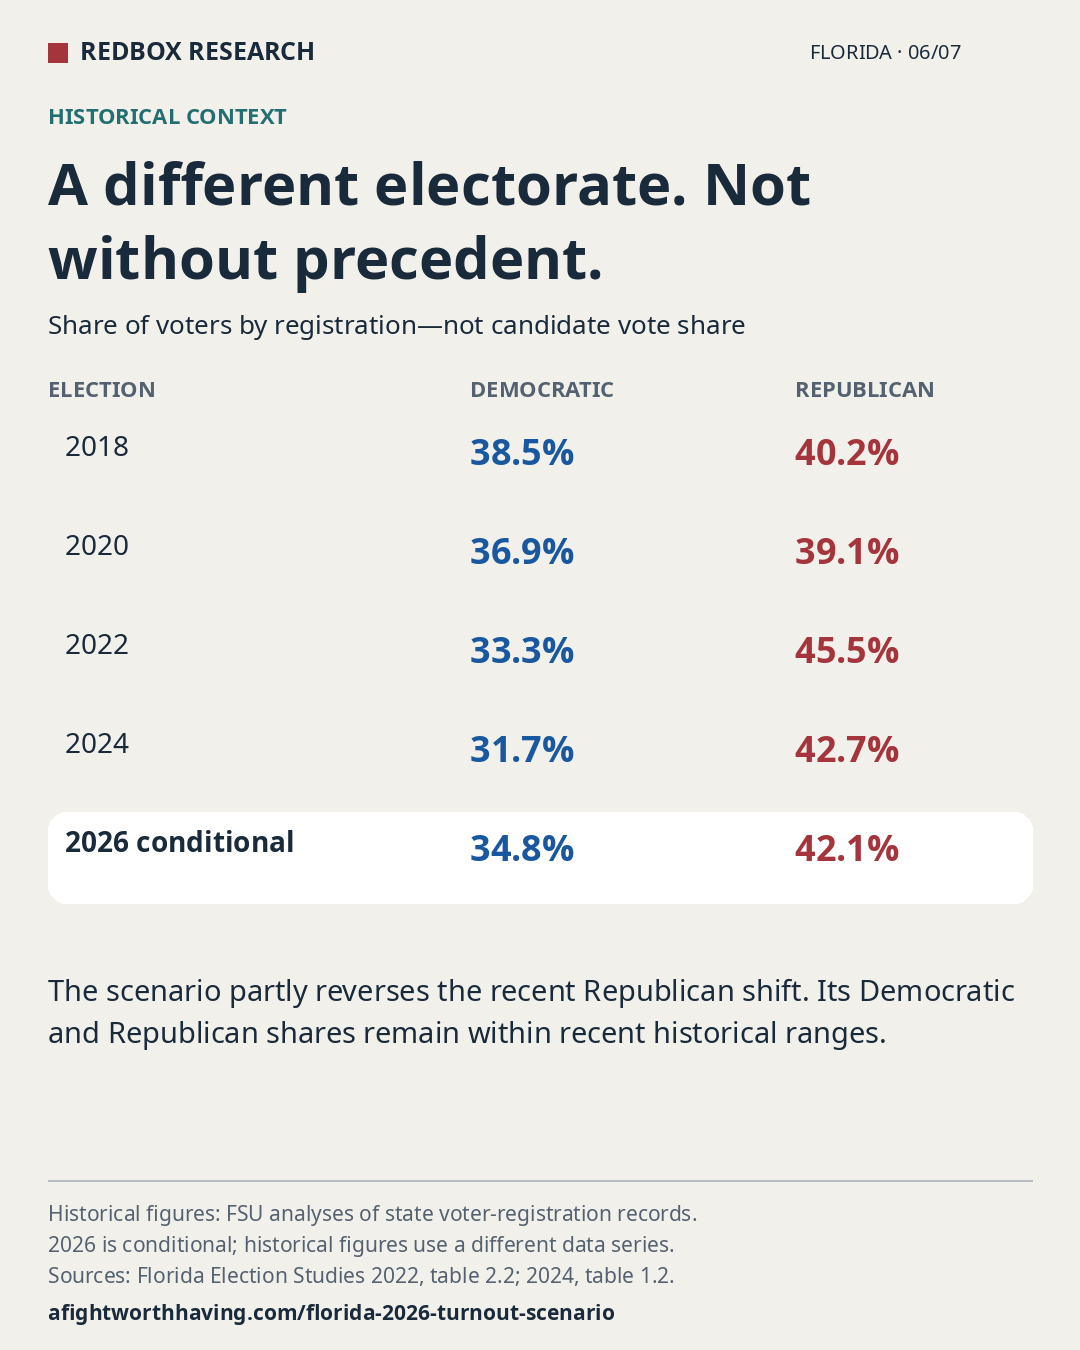
Historical registration shares are from the FSU Florida Election Study 2022, table 2.2 and 2024 study, table 1.2. Their recap-file estimates differ slightly from our reconstructed 2022 mix. The historical card shows Democratic and Republican registration shares only; our scenario continues to keep NPA and minor parties separate.
Methods and sources
RedBox Research, AFWH’s polling unit, conducted the original English-language web survey through text-message invitations to voters sampled from the voter file. A Fight Worth Having, a super PAC, sponsored it. The 4,823 interviews were conducted October 20–23, 2026. No additional interviews were collected for this scenario. All completed respondents were reconciled to voter-file registration, including 897 NPA respondents; no self-identification substitute was used.
The exact weight adjustment is: original respondent weight × projected registration-group share ÷ original weighted registration-group share. It preserves relative weights within each group. Undecided and other-answer categories remain in the denominator. Minor-party registrants are pooled with their existing weighted internal mix. Figures are calculated before rounding.
The certified 2022 turnout total is 7,796,916. Final turnout by registration group is reconstructed from county feeds, excluding provisional submissions, and proportionally reconciled to certified county totals. Orange uses its separate official workbook. Seminole’s missing Election Day coverage leaves a 63,003-ballot gap allocated using reported party proportions; positive county discrepancies total 64,911 ballots. Those allocations introduce uncertainty into the projection.
The separate 60-county timing comparison uses no imputation or rescaling. It excludes Broward and Manatee because their 2024 feeds differ from certified turnout by more than 0.5%; Orange and Seminole because their 2022 feeds fail that check; and Charlotte, Lee and Sarasota because hurricane-related arrangements complicate voting-method comparisons. Unknown registrations remain separate. Excluding large Democratic counties limits statewide generalization.
The original survey’s margin of error does not measure the uncertainty in this turnout scenario. We have not estimated a calibrated total uncertainty interval or a probability of either candidate winning. Survey coverage, nonresponse, historical reconstruction and changes within registration groups also matter. All calculations were performed separately from the original poll; its answers, weights and published results are unchanged.
- Original survey methodology and questionnaire.
- Florida’s 2026 early-voting report: snapshot October 30, 8:08 a.m. EDT, reflecting reported activity through the preceding day.
- Contemporaneous CBS Miami / News Service of Florida report of the November 4, 2022 official early counts.
- Certified 2022 Florida turnout; Orange County turnout workbook.
- County turnout-feed index, used to locate archived records; examples: Alachua 2022 and Alachua 2024.
- Florida registration by party and 2022 archive: each year’s September 30 snapshot.
Analysis date: October 30, 2026. This page describes a frozen conditional scenario, not a continuously updated election forecast.
Paid for by A Fight Worth Having (www.afightworthhaving.com) and not authorized by any candidate or candidate's committee.